
MS-Excel -: MS-Excel is a desktop application that is used to create and manage spreadsheets. With the help of this application, we can do various types of work such as accounting spreadsheets, employee-manager salary spreadsheets, e.t.c.
Parts of MS-Excel Software
There are various methods and properties that are used to manipulate our excel data. we can write a lot of heterogeneous data in a single workbook. Let’s define some points that we are needed to know about these points in detail-
1.Workbook
Workbook is a file of ms-excel that contains various worksheets in it. These file contains various type of worksheets.
2.Worksheet
Worksheet is a type of sheets that contains rows and columns. The combination of rows and Columns is called cells.
3.Spreadsheets
Spreadsheets is also known as Worksheets.
4.Cell Address
Each row and column has unique address is called cell address.
5.Cell Pointer
Point the specific cell to insert the data is called Cell Pointer. In other words, the Cell pointer is the current position of your inserted cell.
Q.1- How to start the MS-Excel in our Computer System?
To start the ms-excel software in our computer system, two methods are given.
- By mouse pointer
- By keyboard
By Mouse Pointer
The mouse pointer is a pointing device to point the screen’s icon on your monitor. This device helps us to click the sequential options for opening the MS-Excel software.
There are following steps to open the ms-excel is defined below –
- Click on the window button that exists on the lower-left corner.
- After clicking the window button, click the All programs option.
- After clicking the All programs option, then select the Microsoft office option.
- After select the Microsoft office option, then select the Microsoft Excel option.
- After selecting the MS-Excel option, you can get a new window of Microsoft Excel software.
By Keyboard (Shortcut way)
Keyboard is also a input device to give the instruction to the Computer system. we can open a ms-excel program with the help of keyboard.
There are following steps to open the ms-excel is defined below.
- Press the window+R button to open the Run command window on your desktop window.
- Then, type the “excel” word without spacing and double inverted commas.
- Then, hit the Enter button or click the Ok button.
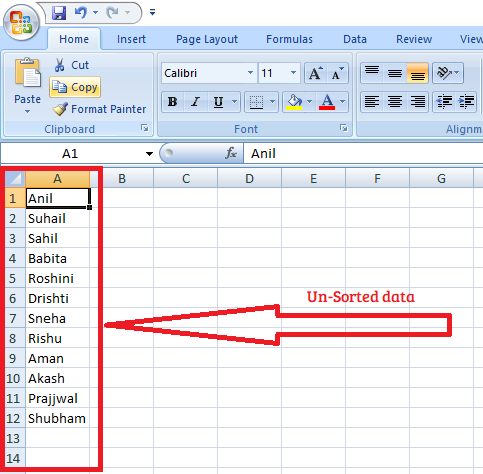
Ques-2: How to sorting the data in ms-Excel
Sorting is the process to manage your data in the sequential order, either ascending order or descending order.
Steps:
- Open MS-Excel.
- Insert the data in cells.
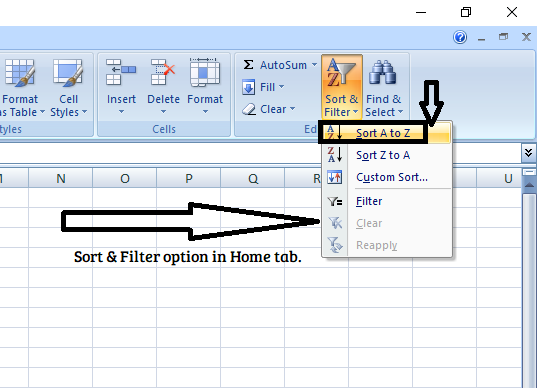
- After inserting the data, click on the Home Tab then click on the Sort and Filter option.
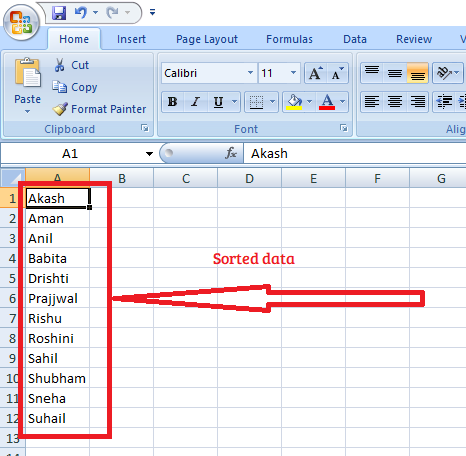
- After clicking on the Sort & Filter option, your record has transformed into sequential manner.
Q.3-: How to filter the data in MS-Excel?
Filtering the data is the process of fetching the conditional statement. In other words, filtering is the process of specified data, on which a condition lies. There are the following steps to filter the data.
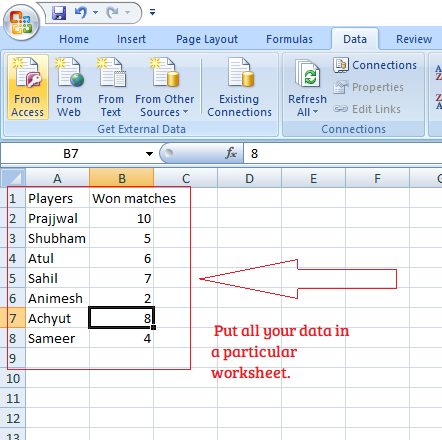
Step 1:
First of all, enter your all data in a specified spreadsheet.
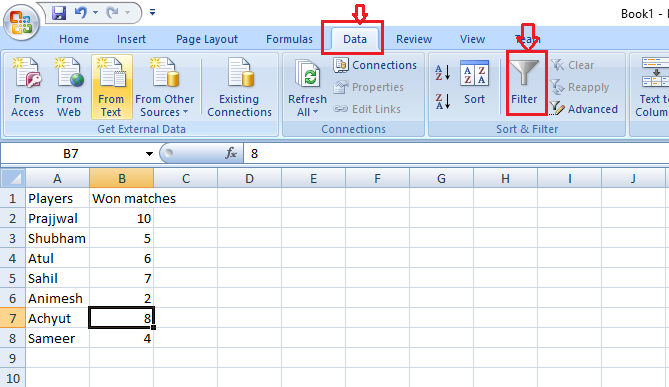
Step 2:
Then, click on the Data Tab and select “filter” menu bar option.
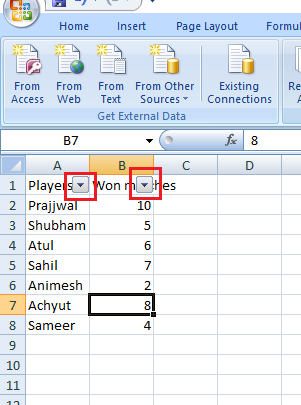
Step 3:
After selecting “filter” menu bar option, we will see the dropdown button at our top of data.
Step 4:
click the dropdown button and set the condition for how filter your data.
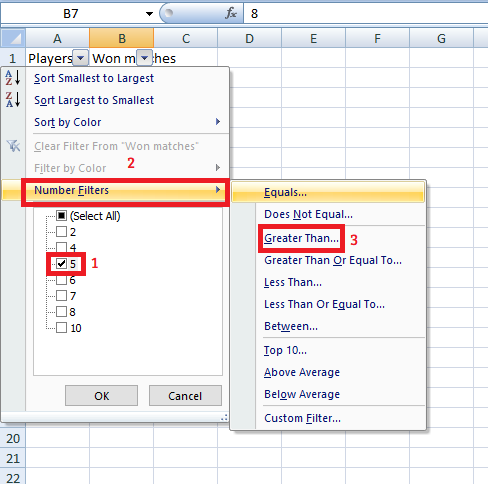
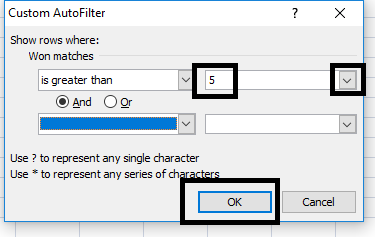
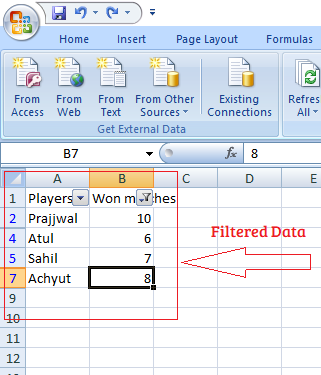
Step 5:
Then click the “OK” button and after, look it at your data again.
Q-4 Define charts and how many types of a component of charts are used in the ms-excel?
Definition of Chart
We can also create a graphical representation of data with the help of the charts function in ms-excel. Charts are those type of data which is used in place of simple data. we can also create various types of charts such as (bar chart, column chart, line chart, pie chart, Area chart, scatter charts,e.t.c.).
Components of a Chart
Chart contains various types of component and their properties which is defined below.
1-: AXIS
Charts contains two type of axis.
- (i) One is x-axis or category axis. direction of x-axis is horizontal.
- (ii) Second is y-axis or value axis and direction of y-axis is vertical. y-axis holds the value of each data point.
2-: Chart Area
Chart area is a area on where all the charts components are defined.
3-: Plot Area
The plot area consists of x-axis and y-axis on two sides of the chart.
4-: 3-D Plot Area
In a 3-D charts, XY plane area or base area is called floor and YZ, XZ plane area or vertical plane area is called walls.
5-: Data Series
Data Series is a entry of data from which the chart is created.
6-: Title
There are two type of title.
Chart title –
Chart title is a title of chart that is placed at the top of the chart.
Axis title –
Axis title is a title name of the X-AXIS, Y-AXIS and Z-AXIS.
7-: Data Label
This label provides additional information about a data marker that represents a single data item coming from a worksheet cell.
8-: Legend
Legend is a type of information that is dependent on the chart’s data. It identifies all the data entries with the special symbol or special pattern. generally, Legend exists at the right of the chart.
9-: Gridlines
Gridline is a line that identifies a particular data entry and makes it understandable.
Q.5 -: What are the different types of charts available in MS-Excel?
In MS-Excel, various types of charts are used to represent different types of data formats. we will see all types of charts with their explanation.
1-: Line Chart
A line chart shows the data in a line format that represents the changing of value over a period of time.
2-: Column Chart
Column chart shows the data in a vertical bar format. This chart represents the data changing over a period of time.
3-: Bar Chart
Bar chart is a type of chart that is helpful for comparisons of individual figures.
4-: Scatter Chart
A Scatter chart is a type of chart that is helpful for representing the data in the form of plotting the point with a marker at the X and Y-axis.
5-: Bubbles Chart
A bubble chart is a type of chart that is helpful for 3-D representation of data in the form of bubbles.
6-: Pie Chart
A pie chart is a type of chart that is helpful for a single type of data and that single type of data splits into multiple sub-data which is represented by a circular chart.
7-: Cones, Cylinder and Pyramid Charts
These charts are used to give a dramatic effect to 3-D column and bar charts.
8-: Doughnut Chart
It is also a circular chart in which the relationship of parts to a whole is displayed. Each ring of the doughnut chart represents a data series.
9-: Radar Chart
It plots data in concentric circles. Lines joining all values connect them in the same series.
10-: Area Chart
An area chart is similar to line chart. However, the data point markers are not displayed and the area between the lines is filled with different color.
11-: 3-D Surface Chart
It gives a 3-D view of the data. A topographic map is an example of this type of chart.


